
OKRs
Put measurable key results under your objectives and check in on them quarter by quarter
OKRs (Objectives and Key Results) turn a goal into numbers you can check in on. In Exponential an Objective is a Goal, and each Key Result under it has a start value, a current value and a target. Key results are grouped by period — a quarter or a year — so the dashboard always shows what the workspace is betting on right now.
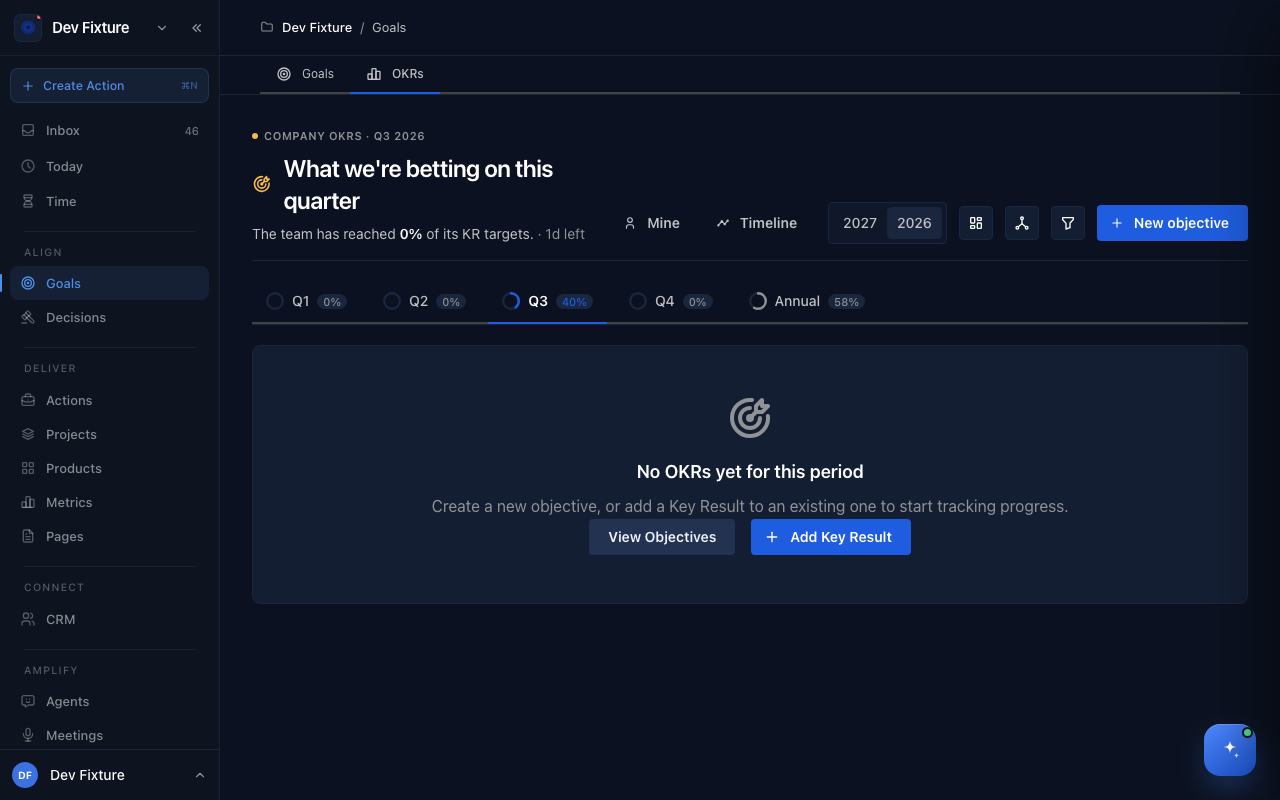
Where to find it
Open Goals — or Align → Goals in the sidebar — and switch to the OKRs tab. The OKR plugin is on by default; a workspace owner can turn it off under workspace settings → Plugins (see Plugins).
How to pick a period
- Click Q1, Q2, Q3, Q4 or Annual under the heading. Each tab shows that period's progress.
- If more than one year has OKRs, use the year switch beside the tabs.
The heading reads What we're betting on this quarter while the period is open, and switches to past tense once it has ended.
How to add a key result
- Click Add Key Result — in the empty state, or beside an objective.
- Choose the Objective (Goal) it belongs to. If you need a new one, click New objective at the top of the page instead; it opens the goal form.
- Give it a Key Result Title, an optional Description, and a Period.
- Set the Start Value and Target Value, and pick a Unit: Percentage (%), Count (#), Currency ($), Hours or Custom with your own Custom Unit Label.
- Save. The key result appears under its objective with a progress bar.
How to check in
- Click a key result to open it.
- Click Update progress, enter the new current value and, if you like, a note about what changed.
Progress is the share of the distance from start to target that you have covered. The status updates itself on every check-in: Achieved at 100%, On track from 70%, At risk from 40%, Off track below that. To overrule it, click Edit on the key result and set Status and Confidence (%) by hand. An objective's own health is set from its page with Set status manually.
How to read the dashboard
- The overview cards show Quarter progress, Key results by confidence, Check-ins this week and Trajectory. Hide or show them with the toggle beside the period tabs.
- Group objectives switches between None and Life domain.
- Filter by status narrows to On track, At risk, Off track or Not started.
- Mine shows only objectives and key results you are the DRI on; Timeline lays the period out on a timeline.
- A Zoe noticed: banner appears above the list when Zoe spots something worth a look, such as a key result with no recent check-in.
How it connects
- Goals — every objective is a goal; its progress bar is calculated from its key results unless you set it manually.
- Projects — the project form has a Link to Key Results field, so the work that moves a number is visible from the key result.
- Weekly plan — the weekly plan includes an OKR check-in step for the current period.
Tips
- Keep the Start Value honest. A key result that starts at zero when you are already halfway shows progress you have not made.
- Two to four key results per objective is enough to see whether it is moving.
FAQ
Is there an OKR widget on the home page? Not yet. The dashboard on the OKRs tab is the only place progress is summarised.
Can I use half-year periods? No. Periods are the four quarters and Annual.
Who can check in on a key result? Its owner and any member of the workspace. Agents can post check-ins too, through the API.