
Retrospectives, insights & metrics
The rest of a product's tabs: retrospectives per cycle, the insights surface where research and problems land, and the delivery metrics page
Beyond the backlog, a product keeps three kinds of memory. Retrospectives record what a cycle taught you. Insights are the evidence behind the roadmap: pain points, feedback, personas, journeys and competitive observations, captured directly or through research sessions and public forms. Metrics is a read-only dashboard of how the product is delivering, cycle by cycle. All three need the Product Management plugin; see Products.
Where to find it
- Retro and Insights are tabs on every product page (Deliver → Products, then the product).
- Metrics is its own sidebar item under Deliver, workspace-wide, once the plugin is on.
- Research sessions live under the product's Insights tab; the older Problems and Research entries feed into the same surface.
How to run a retrospective
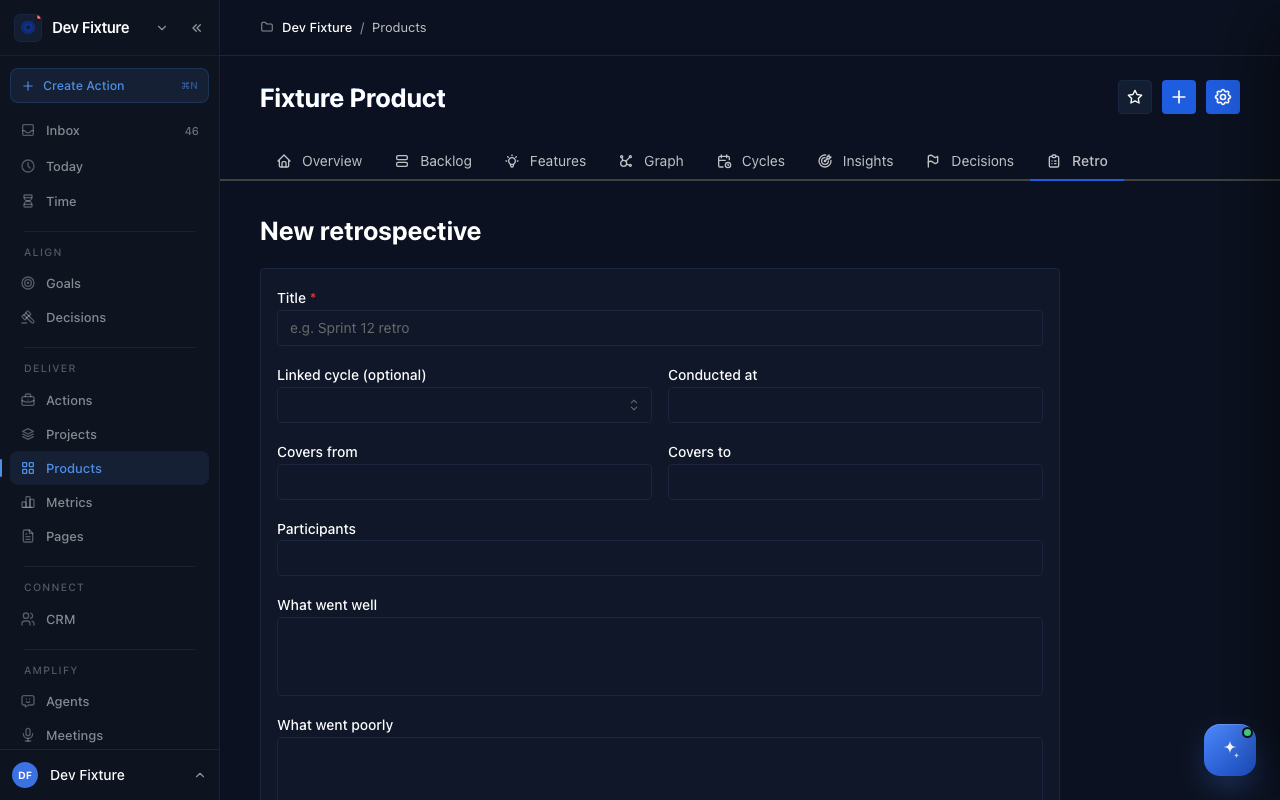
- On the product's Retro tab, click New retrospective.
- Give it a Title, optionally a Linked cycle, when it was Conducted at and the period it Covers from and to, and the Participants.
- Write What went well, What went poorly and the Action items, then Create retrospective.
Retrospectives are listed on the tab newest first; a retrospective ceremony's occurrence can also capture one from the recorded meeting.
How to capture insights
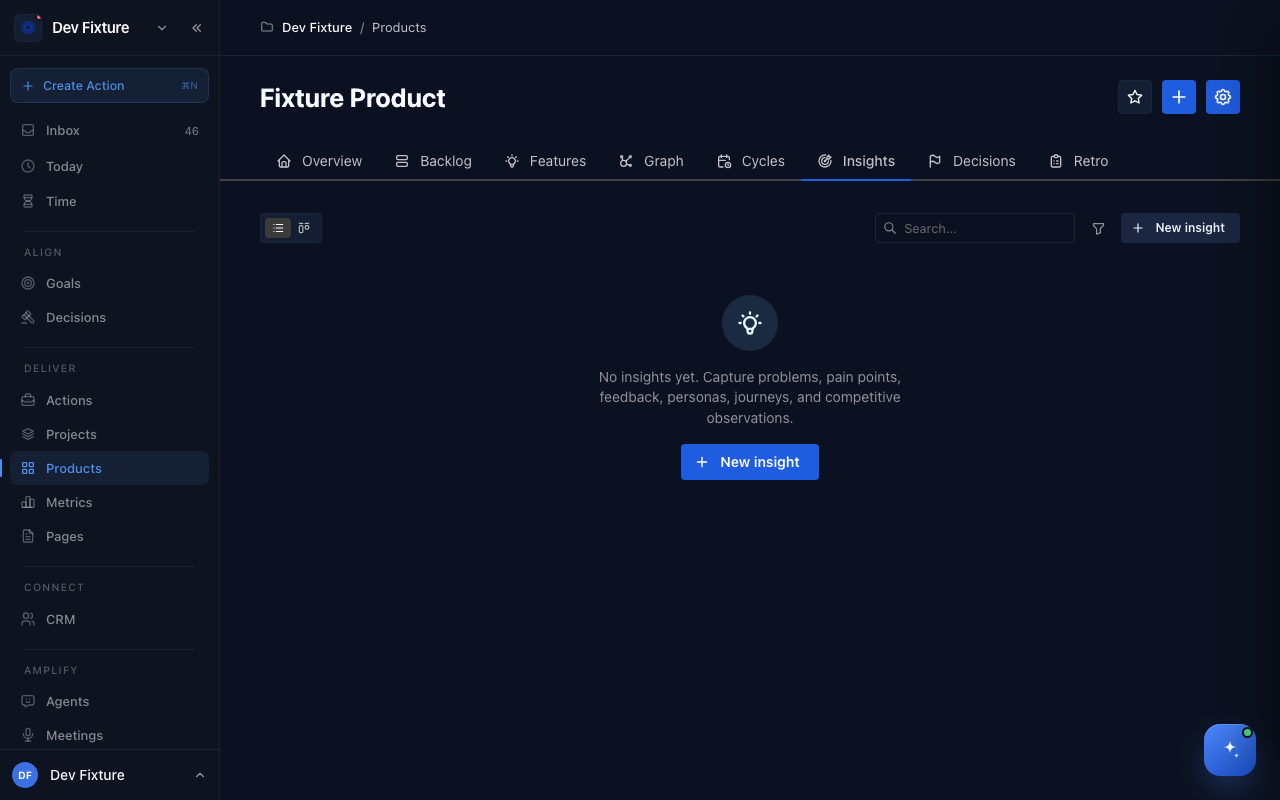
- On the Insights tab, click New insight.
- Choose a type: pain point, opportunity, feedback, persona, journey, observation, competitive or problem. Add the source it came from.
- Insights arrive in Inbox; triage each one: link it to the feature it argues for (it then shows on the feature as evidence), Park it with a reason, mark it a Duplicate of another insight, or Dismiss it. An insight can also be made Visible on the public feedback board.
Insights also arrive on their own: a public form can create one on submission, and a research session's findings are filed here.
How to record research
- From the product's Overview quick actions, click New research (research sessions are listed with the insights).
- Enter a Title, the Type of study, when it was Conducted at, the Participants and your Notes, then Create research.
- File what you learned as insights hung off the session, so each pain point points back to the interview it came from.
How to read the Metrics page
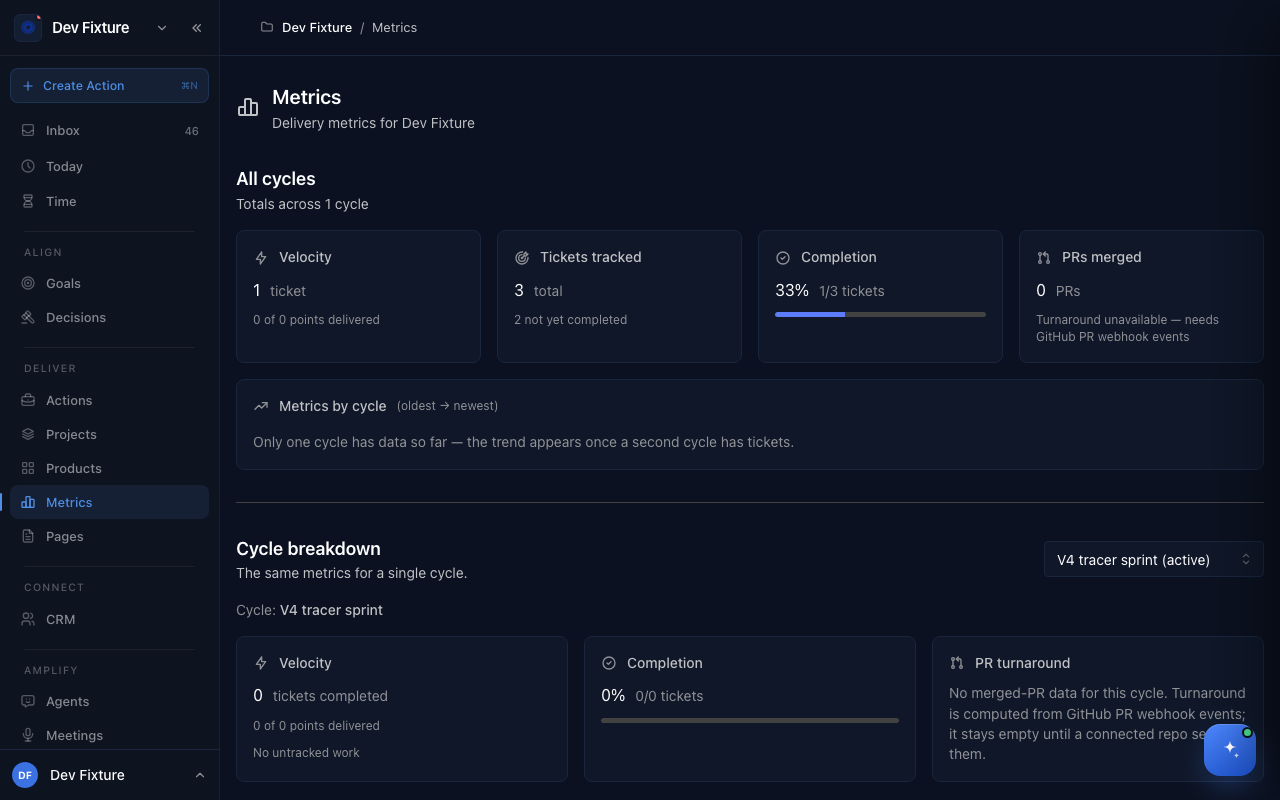
Metrics shows, for All cycles and per cycle:
| Metric | What it measures |
|---|---|
| Velocity | Tickets completed in the cycle, with story points delivered alongside |
| Tickets tracked | Tickets in the cycle and how many are not yet complete |
| Completion | Completed tickets as a share of the cycle's tickets |
| PRs merged and turnaround | Pull requests merged in the cycle window and the average time from opened to merged, from GitHub pull request events |
Metrics by cycle draws the trend once two cycles have tickets; Cycle breakdown repeats the numbers for one chosen cycle. Turnaround stays empty until a tracked repository sends pull request events; see GitHub, Google & Monday.com.
How it connects
- Products — cycles, tickets and features, which everything here reports on: Products.
- Ceremonies — a retrospective ceremony's occurrences carry retro actions onto the next agenda: Ceremonies & occurrences.
- Forms — a public form can file insights straight into a product: Pipeline, forms & broadcasts.
- Sprint insights — the agent-facing view of the same delivery signals: Sprint insights.
- GitHub — the source of the pull request metrics: GitHub, Google & Monday.com.
FAQ
Velocity shows tickets, not points. The headline is the completed-ticket count; points delivered are shown beside it and depend on tickets having story points.
Why is there no trend line? It appears once a second cycle has tickets.
Where did Problems go? Problems are an insight type now; the old Problems page feeds the Insights tab.